Complete Visibility into Your ClickHouse® Infrastructure
Monitor cluster health, analyze performance, track system resources, and gain real-time insights into every ClickHouse® node—all from a single, intuitive interface.
Introduction
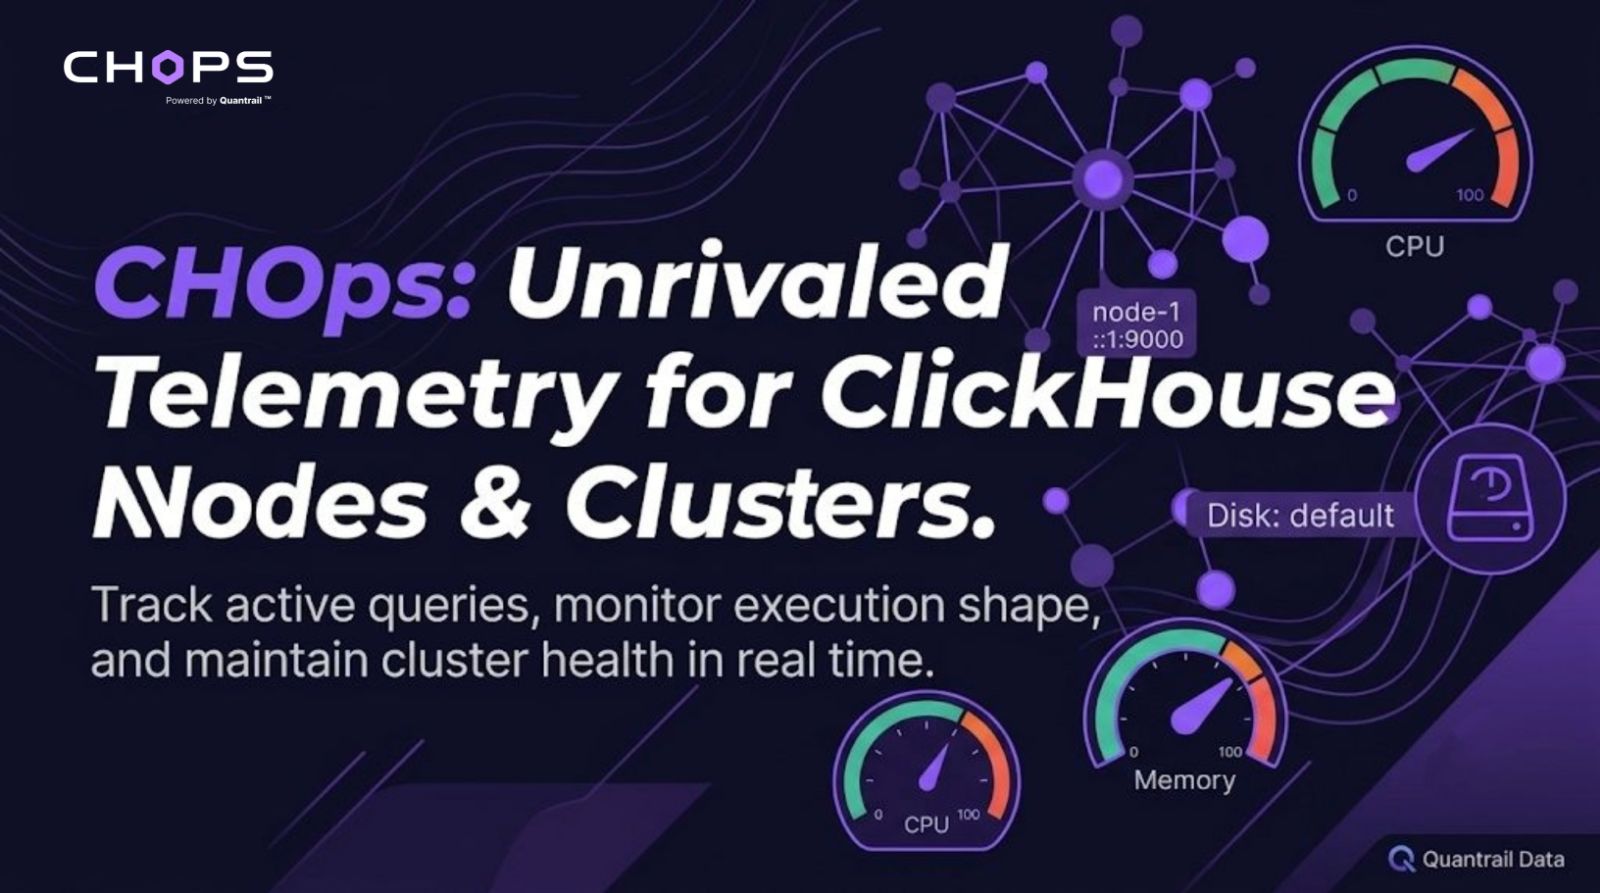
ClickHouse® has established itself as the gold standard for high-performance, real-time analytical databases. However, sustaining sub-second query performance at scale requires continuous monitoring of database internals—including background pools, thread scheduling, storage parts, and I/O amplification. Our custom management platform, CHOps, provides real-time telemetry across every layer of your ClickHouse nodes, bridging hardware metrics with native database engine states.
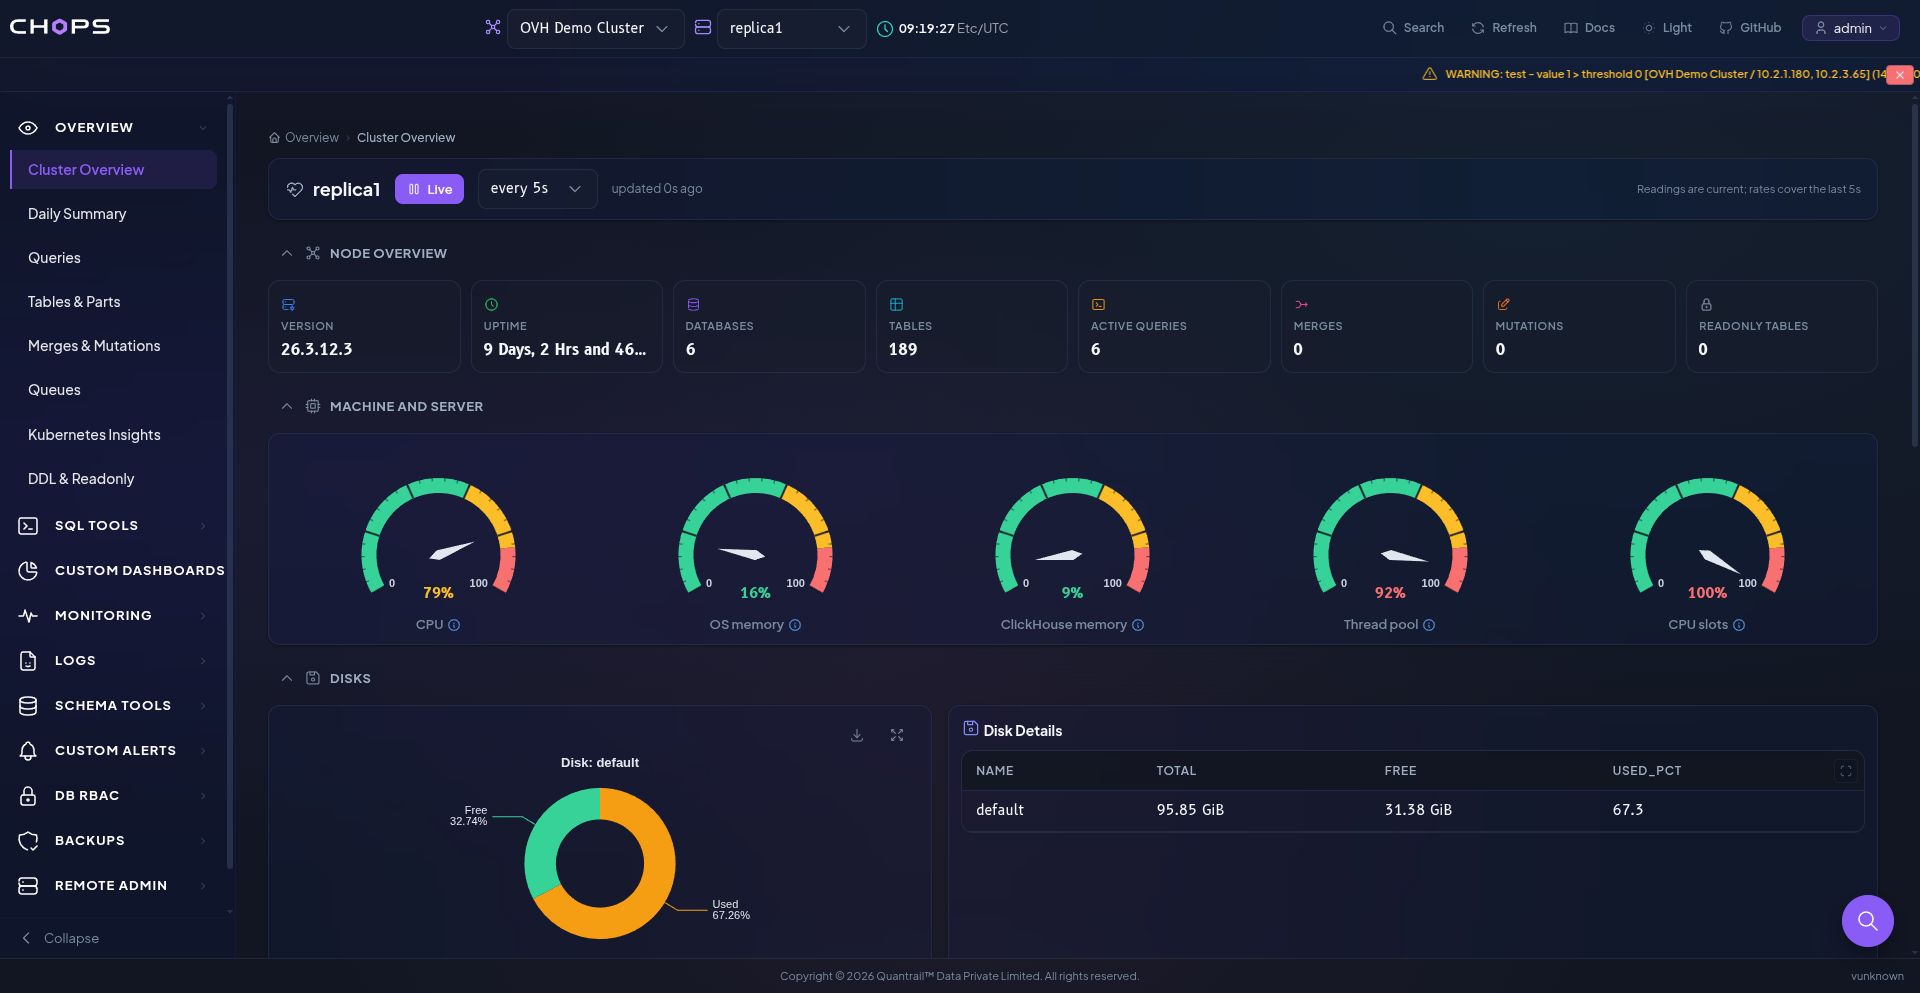
Key Features & Dashboard Overview:
1. Machine & Node Telemetry
- CHOps presents real-time gauge metrics updated dynamically (e.g., every 5s):
- Resource Allocation: CPU utilization, OS Memory, ClickHouse-specific Memory, and Thread Pool saturation.
- Node Summary: Instant visibility into active database versions, total databases, table counts, active queries, running merges, and mutations.
2. Disk & Storage Health Check
- Disk Partitioning: Tracks raw space utilization (default storage at 457.00 GiB with 53.6% used).
- Part Formats: Monitors the breakdown between Compact (76.46%) and Wide (23.54%) storage parts to ensure efficient write operations.
- System Health Checks: Automated monitoring across 15+ critical health states including Delayed inserts, Spilling to disk, Keeper expired, Readonly replicas, and Broken disks.
3. Background Pools & Execution Shaping
- Pool Capacity vs. Usage: Real-time histograms for background tasks including Merges, Fetches, Moves, Schedule, Buffer Flush, Distributed operations, and Message Brokers.
- Efficiency & Compression Ratios: Live tracking of Read Amplification (e.g., 566.1 rows/row), Write Amplification, and Read Compression (16.0x).
4. Query & Time Execution Profiling
- "Where the Time Goes": Granular thread-level decomposition showing exact thread usage spent on Disk Read, CPU User, Merge Exec, CPU Kernel, and Disk Write.
- In-Flight Metrics: Tracking active query locks, I/O in flight (Open read/write operations), memory consumption by mapped files vs. server runtime, and thread distribution.
| ** Storage Usage ** | **Part Breakdown ** | Read Compression | Read Amplification |
|---|---|---|---|
| 457 GiB (53.6% Used) | Compact: 76.5% Wide: 23.5% | 16.0x Ratio | 566.1 rows/row |
Advantages of Using CHOps
Early Detection of Bottlenecks
- Instantly spot write-amplification spikes or thread pool exhaustion before queries degrade.
Data Compression Optimization
- Track part churn and row compression ratios to optimize storage policies and partition schemes.
Simplified Cluster Management
- Monitor cluster topology, replica delays, and Keeper/ZooKeeper connections in a single unified dashboard
ClickHouse Architecture: Clusters & Nodes Explained
1. What is a ClickHouse Node?
A Node is a single running instance of the ClickHouse server process (clickhouse-server) on an isolated physical machine, virtual server, or container.
- Role: A node stores local table parts (using engines like MergeTree), receives SQL queries, parses/compiles them, and processes data using vectorized multi-threaded execution.
- In Your Dashboard: Highlights node-1 (localhost ::1:9000), showing its specific runtime metrics like uptime (21 mins), active queries (2), CPU, and RAM allocation.
2. What is a ClickHouse Cluster?
A Cluster is a logical grouping of multiple ClickHouse nodes working together to handle massive analytical datasets across distributed infrastructure.
- Sharding & Replication: Clusters split dataset subsets across different nodes (sharding) or duplicate data for high availability (replication) using Distributed table engines and ClickHouse Keeper/ZooKeeper.
- Horizontal Scaling: When data volume or query load grows beyond a single machine's capacity, adding nodes to a cluster expands storage capacity and query execution power in parallel.
Conclusion
As analytical workloads grow in volume and complexity, maintaining deep visibility into database internals becomes a necessity—not a luxury. CHOps bridges the gap between high-level database administration and low-level engine telemetry, ensuring your ClickHouse clusters remain resilient, performant, and cost-efficient. By transforming complex metrics—like memory footprints, thread pool allocation, write amplification, and part formats—into clear, real-time visual insights, CHOps empowers data engineers and DevOps teams to preempt bottlenecks before they impact production.
Note: Don't confuse general system-level host monitoring (like standard Prometheus or Grafana OS exporters) with the engine-native telemetry provided by CHOps. While standard infrastructure tools only track raw host metrics, CHOps explicitly surfaces ClickHouse-specific engine internals—such as background merge queues, part formats (Compact vs Wide), read/write amplification, and thread pool scheduling. This blog focuses specifically on deep ClickHouse database performance optimization using CHOps.